
What Is Gross Rent Multiplier in Real Estate Investing
- Sarah Porter

- Oct 19, 2025
- 13 min read
Updated: Oct 21, 2025
When you're sifting through dozens of rental property listings, how do you quickly tell the contenders from the pretenders? You need a fast, back-of-the-napkin way to gauge a property's value before you spend hours on a deep-dive analysis.
That's where the Gross Rent Multiplier (GRM) comes in. Think of it as a simple yardstick. It tells you how many years it would take for a property's gross rental income to completely pay off its purchase price. It’s a first-glance metric perfect for comparing multiple properties on the fly.
What Is Gross Rent Multiplier Anyway?

Imagine you're at a real estate investor meetup, and someone asks you to quickly size up a property. The GRM is the tool you'd use. It cuts through the noise and frames a property's price purely in terms of its raw income-generating power.
Essentially, the GRM is a ratio that pits the property's market price against its annual gross rental income. It's calculated before you factor in any operating expenses like taxes, insurance, or maintenance. This simplicity is its biggest strength and, as we'll see later, its main weakness.
To get a clearer picture right away, here’s a quick breakdown of what goes into the GRM calculation.
GRM At a Glance
Component | What It Means | Example |
|---|---|---|
Property Price | The total purchase price or current market value of the property. | $300,000 |
Annual Gross Rent | The total rent collected over one year, before any expenses. | $30,000 (from $2,500/month rent) |
GRM Calculation | Property Price / Annual Gross Rent | $300,000 / $30,000 = 10 GRM |
This table shows just how straightforward the concept is. A lower GRM often signals a potentially better investment, as you'd theoretically pay back the property's price faster.
The Purpose of a Quick Filter
The primary job of the GRM isn't to give you a definitive "buy" or "don't buy" signal. Its real value is as an initial screening tool. It helps you efficiently sort through a long list of potential deals, separating the promising ones from those that are clearly overpriced.
With this simple metric, you can:
Quickly Compare Listings: Instantly see how different properties in the same market measure up against one another.
Identify Potential Overpricing: A GRM that's way higher than the local average is a major red flag that the asking price might be inflated.
Focus Your Due Diligence: Save your precious time by concentrating your in-depth financial analysis only on the properties that pass this first critical test.
The real power of GRM lies in its simplicity. It’s not meant to be a comprehensive analysis but rather an essential first step that brings clarity and efficiency to your property search.
By understanding what the gross rent multiplier is, you're adding a vital first-pass filter to your investor toolkit. For a more detailed breakdown, you can also check out this helpful What Is Gross Rent Multiplier? An Investor's Guide.
Now, let's get into how you can calculate and apply this number to your own investment search.
How to Calculate Gross Rent Multiplier
Figuring out the Gross Rent Multiplier is refreshingly simple. You don't need a fancy financial calculator or a complicated spreadsheet; just two key numbers will do the trick: the property's price and its total yearly rent.
Here's the formula in all its glory:
GRM = Property Price / Gross Annual Rent
That’s it. The number you get tells you how many years it would take for the gross rent to completely pay off the property's purchase price. Think of it as a quick "back-of-the-napkin" test to see if a deal is even worth a second look.
This simple process flow diagram shows you just how straightforward it is.
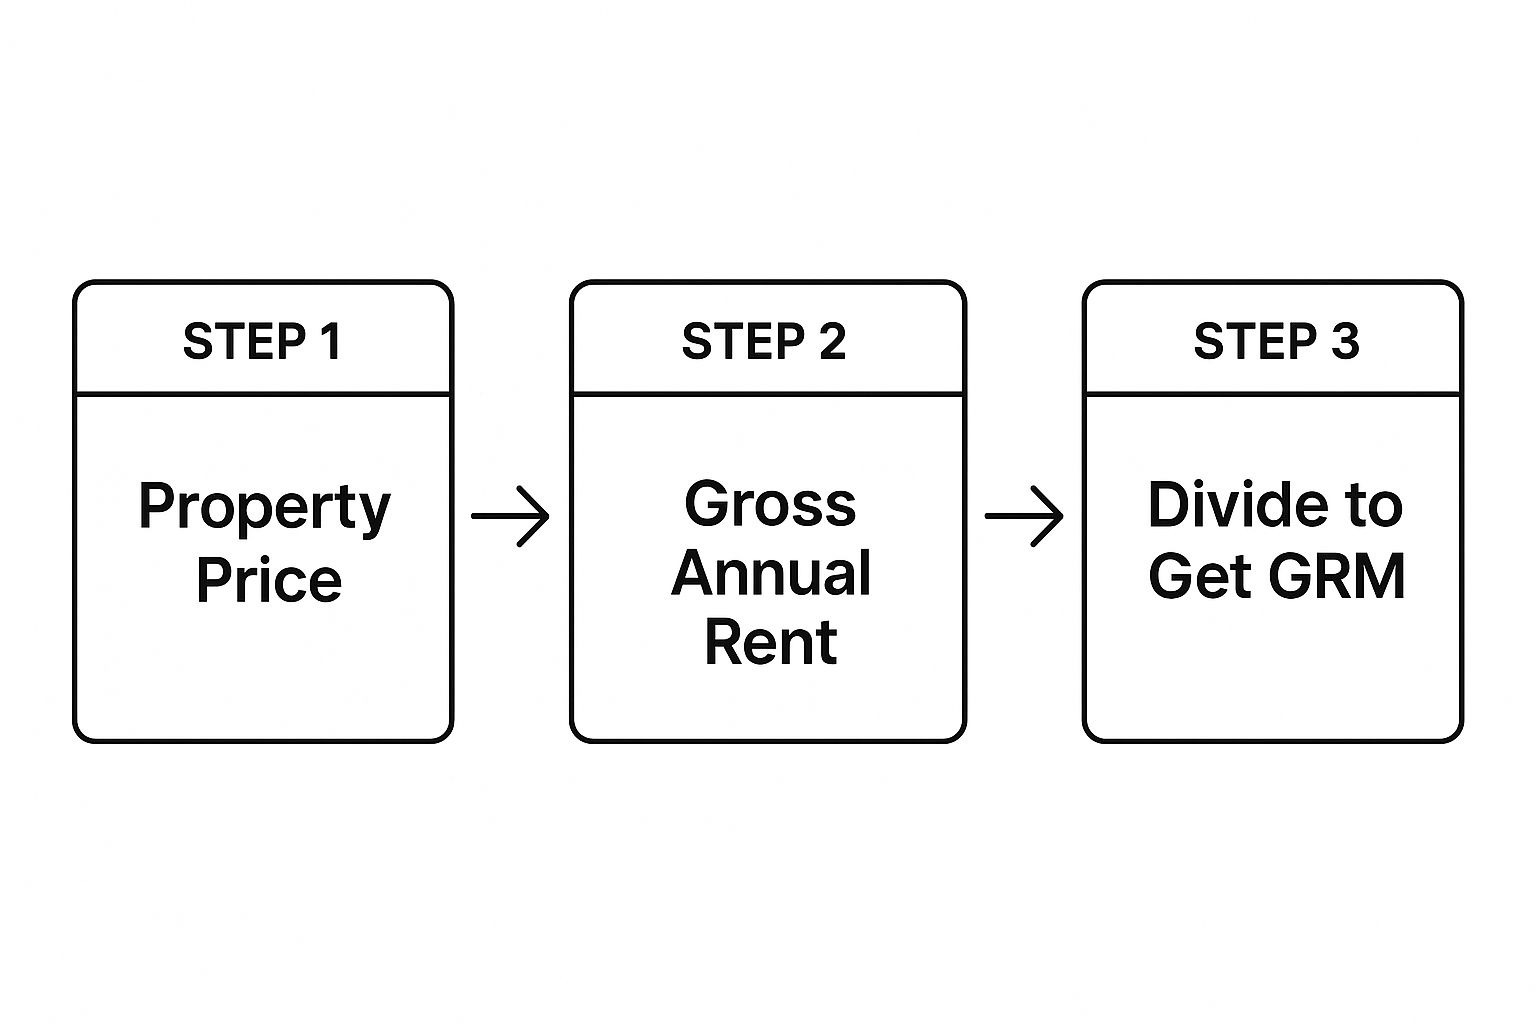
As you can see, it’s a direct division of the price by the annual rent. No complex variables, just a clean, simple ratio.
Breaking Down the Calculation
Let's walk through it with a real-world example. Say you're eyeing a single-family home in the suburbs.
Find the Property Price: This is just the asking or sale price. Let’s assume the house is listed for $360,000.
Determine the Gross Annual Rent: If the property rents for $2,500 per month, you'll need the yearly figure. Just multiply that by 12, which gives you $30,000 a year.
Divide to Find the GRM: Now, plug those numbers into the formula: $360,000 / $30,000 = 12.
So, the GRM for this property is 12. In simple terms, it would take 12 years of collecting rent—before factoring in a single expense—to match what you paid for the house.
A Common Pitfall to Avoid
The most common mistake I see investors make is accidentally using the monthly rent instead of the annual rent. It seems like a small slip-up, but it throws the entire calculation off and makes the result completely useless for comparing properties.
Always convert monthly rent to an annual figure by multiplying by 12 before you calculate the Gross Rent Multiplier. This ensures you are using the industry-standard metric and comparing properties accurately.
Let's look at another example to see how big of a difference this makes. Imagine an urban duplex priced at $450,000. Each unit brings in $1,600, for a total of $3,200 in monthly rent.
Correct Annual Rent: $3,200/month x 12 = $38,400
Correct GRM: $450,000 / $38,400 = 11.72
Now, if you mistakenly used that monthly number:
Incorrect Calculation: $450,000 / $3,200 = 140.6
See the problem? A GRM of 11.72 is a reasonable number for analysis, but 140.6 is meaningless. Sticking to the annual rent gives you a reliable benchmark, allowing you to confidently sift through potential deals and focus only on the ones that make sense.
Interpreting Your GRM Number

So, you've run the numbers and have a GRM staring back at you. What does it actually mean? It’s tempting to think a low number is a clear winner and a high one is a definite loser, but that’s a rookie mistake. The real story is in the context.
A “good” GRM isn’t some universal magic number. It’s a moving target, shifting from one city to the next, and even between neighborhoods just a few blocks apart. While a lower GRM generally points to a quicker payback period from rental income, you can't evaluate it in a vacuum.
Think about it this way: a property with a GRM of 8 in a booming city with new employers moving in might be a golden opportunity. Compare that to a property with a GRM of 6 in a town where the biggest factory just shut down. The lower number looks better on paper, but the potential for future rent growth and appreciation in the vibrant market is something the simple GRM formula just can't show you.
Establishing a Local Benchmark
To make your GRM number truly useful, you have to measure it against the local competition. It’s like knowing a car gets 30 miles per gallon—that figure is only helpful when you know what other cars in its class are getting. Your mission is to figure out the typical GRM for similar properties in your specific target area.
How do you find that benchmark?
Scour the Listings: Start by calculating the GRM for a handful of comparable rental properties currently for sale.
Talk to the Experts: Local real estate agents and property managers live and breathe this stuff. They can often give you a solid feel for the current GRM range.
Dig into Past Sales: Look at what similar rental properties have sold for recently. This helps you build a historical baseline for your comparisons.
Remember, your GRM is a relative metric. It gains its power not in isolation, but in comparison to the prevailing numbers in your specific investment market.
As a broad rule of thumb, GRMs often land somewhere between 4 and 12. In big, competitive cities, you might see GRMs hovering around 6 to 8, but in smaller or up-and-coming areas, it’s not unusual to see them climb to 10 or higher, indicating a longer payback period. For a deeper dive, you can find more insights on what makes a good GRM on trionproperties.com.
Once you’ve established that local benchmark, your GRM becomes a powerful sorting tool. You can quickly flag properties that seem attractively priced (lower than the average GRM) or those that might be overpriced (higher than the average GRM). This lets you focus your time and energy on the deals that actually deserve a closer look.
When To Use GRM and When To Be Cautious
The Gross Rent Multiplier is a fantastic tool to have in your back pocket, but you have to know its job. Think of it like a metal detector on a beach full of buried treasure. It's incredibly fast and simple, letting you scan a huge area—or in our case, dozens of property listings—to get a quick beep that something valuable might be underneath.
Its real magic is speed. With just two numbers, you can run a quick, high-level comparison between a bunch of properties and immediately spot which ones stand out from the pack. That kind of efficiency is priceless when you’re sifting through a long list of potential deals and need to narrow it down to a handful that are actually worth your time.
The Major Blind Spot: Operating Expenses
But here's the catch: the simplicity that makes the GRM so fast is also its biggest weakness. The formula is intentionally blind to one of the most important parts of a rental property's financial health: operating expenses. It completely ignores the real-world costs that chip away at your rental income month after month.
This means the GRM doesn't see things like:
Property Taxes: A huge, unavoidable expense that can vary dramatically from one town to the next.
Homeowners Insurance: Absolutely essential for protecting your investment.
Maintenance and Repairs: From a dripping faucet to a whole new roof, these costs are a fact of life for landlords.
Property Management Fees: If you hire a pro to manage the property, this can easily be 8-12% of your gross rent.
Vacancy Rates: Properties don't stay rented 100% of the time, but the GRM calculation assumes they do.
Because of this massive blind spot, a property with a great-looking GRM could actually be a money pit. Picture two identical houses, both selling for $300,000 and renting for $2,500 a month. They both have the exact same GRM of 10. But what if one has low property taxes and a brand-new roof, while the other is in a high-tax area and needs constant, costly repairs? The GRM sees them as equal, but one is clearly a much, much better investment.
To help you weigh these factors, here's a quick side-by-side look at where the GRM shines and where it falls short.
Gross Rent Multiplier Advantages vs Disadvantages
Advantages (Pros) | Disadvantages (Cons) |
|---|---|
Simple and Fast: Calculation takes seconds with just two numbers. | Ignores Expenses: Doesn't account for taxes, insurance, or maintenance. |
Great for Quick Comparisons: Easily compare multiple properties in the same market. | Doesn't Reflect Cash Flow: A low GRM doesn't guarantee profitability. |
Identifies Outliers: Helps you spot potentially underpriced properties quickly. | Assumes 100% Occupancy: Fails to consider the real-world impact of vacancies. |
Widely Used: Easy to find the necessary data (price and rent) on most listings. | Can Be Misleading: Properties can have the same GRM but vastly different financial outcomes. |
Ultimately, the GRM is a powerful first-pass filter, but a terrible final decision-maker.
GRM: The First Step, Not The Final Word
The trick is to use the GRM as the starting line for your analysis, never the finish line. It's the tool that tells you which properties are worth pulling out your calculator for a deeper dive. Once a property passes that initial sniff test, your real work begins.
A low GRM is not a "buy" signal; it is a "look closer" signal. It invites you to investigate the expenses, vacancy history, and overall condition of the property to determine its true profitability.
This is where you move from a quick screening to true financial due diligence. You start calculating the Net Operating Income (NOI) and other key metrics that give you the full picture. Understanding how all those ignored expenses affect your bottom line is what separates successful investors from the rest.
To get a better handle on this, check out our guide on what is cash flow in real estate and how it works. By using the GRM wisely, you combine speed with smarts, making sure you only spend your valuable time on the opportunities with real potential.
GRM vs. Cap Rate: A Tale of Two Metrics
Think of the Gross Rent Multiplier as the quick, introductory handshake when you first meet a property. The Capitalization Rate (Cap Rate), on the other hand, is the deep, meaningful conversation that comes next. While GRM gives you a fast first impression based on potential income, the Cap Rate digs much deeper to reveal a property's true profitability.
The entire difference boils down to one critical factor: expenses. The GRM calculation intentionally ignores every single cost associated with owning and running a property. In sharp contrast, the Cap Rate is built on a property's Net Operating Income (NOI), which is the cash left over after you've paid all the necessary operating bills. This distinction is a game-changer for any serious investor.
The Power of Net Income
Net Operating Income is where the rubber meets the road. It forces you to get real about the costs that will eat into your profits. To figure it out, you have to subtract all the operational expenses from your gross income, including things like:
Property taxes and insurance premiums
Routine maintenance and unexpected repairs
Property management fees
Utilities, landscaping, and other day-to-day costs
By using NOI, the Cap Rate gives you a far more accurate snapshot of an investment's potential return. The GRM tells you how a property's price stacks up against its potential income, but the Cap Rate tells you how it compares to its actual income. You can dive deeper into this essential metric in our guide explaining what Cap Rate is in real estate investing.
Why The Second Step Is Critical
Let's walk through a real-world scenario. Imagine two duplexes, both listed for $400,000. Each one pulls in $40,000 in gross annual rent. A quick calculation shows they both have an identical GRM of 10. Based on that number alone, they look like equally good deals.
But when you start looking at the expenses, the story changes completely.
Property A is a newer build with low property taxes. Its total operating expenses are manageable, leaving a healthy NOI of $28,000. This gives it a Cap Rate of 7%.Property B is an older building that needs constant repairs and is located in a high-tax area. Its expenses are much higher, shrinking its NOI down to just $20,000. Its Cap Rate is only 5%.
This is precisely why the Cap Rate is so essential. The GRM saw these properties as twins, but the Cap Rate correctly flagged Property A as the far superior investment. Experienced investors know this pattern well; they use GRM as a quick filter but always rely on Cap Rate for the final decision. A property with a great-looking GRM can easily be a money pit once its high expenses are brought to light.
Putting GRM into Practice: A Case Study
Theory is one thing, but seeing the Gross Rent Multiplier in a real-world scenario is where it all clicks. Let’s walk through an example with an investor, Maya, as she looks at two similar duplexes in the same neighborhood. This is a perfect illustration of how GRM works as a quick, first-pass filter.
Maya has her eye on two properties: one on Oak Street and another on Maple Avenue. She needs a fast way to see which one deserves more of her time and attention, so she starts with the GRM.
The Initial GRM Comparison
Here’s the basic information Maya pulled for her initial comparison:
Oak Street Duplex: Asking price is $450,000. The total gross rent for the year is $40,000.
Maple Avenue Duplex: Asking price is $420,000. The total gross rent for the year is $36,000.
With these two figures for each property, she can run the numbers in seconds.
Oak Street GRM: $450,000 / $40,000 = 11.25
Maple Avenue GRM: $420,000 / $36,000 = 11.67
Right off the bat, the Oak Street duplex seems a bit more attractive because its GRM is lower. A lower number suggests you're paying less for every dollar of rent coming in. But Maya is an experienced investor, and she knows this is just the tip of the iceberg.
A lower GRM is a green light to dig deeper, not a finish line. The true story of a property's value is always hidden in the operating expenses.
Digging Deeper into the Numbers
Now for the crucial next step: looking past the gross rent and into the actual costs. After doing her homework, Maya uncovers some important differences. It turns out the Maple Avenue property has newer plumbing and electrical systems and sits in a slightly more favorable property tax area.
Oak Street Annual Expenses: Property taxes, insurance, and estimated maintenance add up to $14,000.
Maple Avenue Annual Expenses: The same costs for this property are only $9,000.
This changes everything. With this new data, Maya can calculate the Net Operating Income (NOI) and the capitalization rate, which paint a much clearer picture of profitability. The Maple Avenue property, even with its slightly higher GRM, is clearly the better investment once you factor in the lower running costs.
This is a classic example of why GRM is a starting point, not the final word. Maya's process is a great template for analyzing real estate investment deals because it shows you need the full financial picture. It's a similar principle to how you would calculate rental yield for your investment to understand true returns.
Common Questions About the Gross Rent Multiplier (GRM)
Once you get the hang of the GRM formula, you start running into real-world scenarios that bring up new questions. Let's walk through some of the most common ones that pop up when investors start putting this metric to work.
Can I Use Monthly Rent To Calculate GRM?
Technically, you could, but you really shouldn't. The industry standard is to always use the annual rent figure, and sticking to that standard is crucial for making accurate comparisons.
Think of it this way: if you're comparing your property's GRM to market data or other listings, you need to be sure you're looking at apples to apples. To do it right, just take the monthly rent and multiply it by 12. It’s a simple step, but forgetting it is a classic rookie mistake that can completely throw off your numbers and lead you to a bad decision.
Is a Low GRM Always a Good Thing?
Not always. On the surface, a low GRM looks great—it suggests the property is priced low relative to the income it generates. But it's just a first glance, not the full story.
A property might have a fantastic GRM but be saddled with sky-high property taxes, a roof that needs replacing, or a history of long vacancies. The GRM formula is blind to all of these expenses.
A low GRM is best seen as a green light to dig deeper. It tells you a property is worth investigating, but it doesn't guarantee it's a great deal. It’s the start of your due diligence, not the end of it.
How Does GRM Work for Different Kinds of Properties?
The GRM is really in its element with residential properties. It’s most useful for single-family rentals and small multi-family buildings (think duplexes or fourplexes), where operating expenses are generally pretty straightforward and predictable.
But when you step into the world of larger commercial properties like office buildings or retail spaces, investors almost exclusively switch to the Capitalization (Cap) Rate. Commercial properties have much more complex and varied expenses—things like common area maintenance, different utility setups, and management fees. The GRM completely ignores all of that, whereas the Cap Rate, which is based on Net Operating Income, gives a far more precise look at a commercial property's actual profitability.
At Keshman Property Management, we know that metrics like GRM are just the starting point. With over 20 years of hands-on experience, we help investors look beyond the numbers on a spreadsheet to see what makes a rental property truly profitable. Find out how our transparent, owner-focused services can help you at https://mypropertymanaged.com.


Comments