
A Practical Guide to Rental Property Cash Flow Analysis
- Sarah Porter

- Dec 23, 2025
- 17 min read
Updated: Dec 24, 2025
When you're looking at a potential rental property, it’s easy to get sidetracked by the big numbers—the purchase price, the potential appreciation, the gross rent. But the real make-or-break metric, the one that tells you if a property is a winner or a dud, is cash flow.
A rental property cash flow analysis is simply the process of figuring out how much actual cash that property will put in your pocket each month, after every single bill is paid. It's the only way to separate a truly profitable investment from one that just looks good on paper. This isn't just about subtracting the mortgage from the rent; it's about digging into all the operating costs and financing details.
Why Cash Flow Is King In Real Estate
While rising home values and market appreciation get all the media attention, any seasoned investor will tell you the same thing: consistent, positive cash flow is the foundation of a strong real estate portfolio.
Think of it as the lifeblood of your investment. It’s what keeps things running smoothly, covering unexpected repairs and weathering market downturns. Without positive cash flow, you’re not really investing—you're speculating.

New investors often confuse cash flow with profit, but they are fundamentally different. Profit is an accounting term, a number on a spreadsheet. Cash flow is the tangible money you have left over to pay bills, reinvest, or actually enjoy. It’s crucial to understand why your profit doesn't always match your bank balance.
To really understand what we're about to break down, here's a quick-glance table of the core components. This gives you a clear roadmap for the rest of this guide.
The Core Components of Cash Flow
Component | What It Covers | Real-World Example |
|---|---|---|
Gross Potential Income | The total rent you could collect if the property were 100% occupied. | A duplex with two units renting for $1,500/month each ($36,000/year). |
Vacancy & Credit Loss | A realistic estimate for periods when a unit is empty or a tenant doesn't pay. | Assuming a 5% vacancy rate on that $36,000, you'd budget for a $1,800 loss. |
Effective Gross Income (EGI) | Your actual, more realistic income after accounting for potential losses. | $36,000 (Gross Income) - $1,800 (Vacancy) = $34,200 (EGI). |
Operating Expenses (OpEx) | All the costs to run the property, excluding the mortgage. | Property taxes, insurance, repairs, property management fees, utilities. |
Net Operating Income (NOI) | Your property's profitability before mortgage payments and taxes. | $34,200 (EGI) - $12,000 (OpEx) = $22,200 (NOI). |
Debt Service (Mortgage) | The total principal and interest paid on the property loan over the year. | A mortgage payment of $1,600/month equals $19,200 annually. |
Cash Flow | The final number—the cash left in your pocket. | $22,200 (NOI) - $19,200 (Debt Service) = $3,000 annual cash flow. |
This breakdown is the framework every successful investor uses to evaluate a deal. Let's dive into why it matters so much in the real world.
The Real-World Impact Of Cash Flow
Imagine two different investors. The first buys a trendy condo in a "hot" market, accepting negative cash flow because they're banking on rapid appreciation. The second buys a simple duplex in a stable, working-class neighborhood that generates $400 per month in positive cash flow right from the start.
When the market inevitably cools off, the first investor is in trouble. They have to dip into their personal savings every month just to keep the property afloat. It becomes a source of stress.
The second investor? They're completely unbothered by the market headlines. Their property continues to pay for itself and put money in their pocket, month after month.
This focus on income is what separates sustainable investing from gambling. A property that generates positive cash flow can be held indefinitely, allowing appreciation to become a bonus rather than a necessity.
This isn't just an opinion; the data backs it up. Historically, the income generated from rent has been the primary driver of real estate returns, not just appreciation.
Laying The Groundwork For Growth
At the end of the day, a proper cash flow analysis gives you the clarity you need to make smart, confident decisions. It allows you to:
Validate a Deal: Know within minutes if a property is worth pursuing or if you should walk away.
Prevent Nasty Surprises: Force yourself to account for everything, from property taxes to saving for a new roof in 15 years.
Optimize Your Portfolio: Once you own a property, this analysis helps you pinpoint where you can cut costs or increase income to boost your returns.
By making cash flow your top priority, you build a portfolio that produces predictable income, minimizes risk, and creates a reliable path to financial freedom. For a deeper dive into the concept, check out our complete guide on what cash flow is in real estate and how it works.
Building Your Financial Picture: Income and Expenses
A solid rental property analysis always starts with an honest, exhaustive list of the numbers. Before you can even think about calculating cash flow or ROI, you have to create a complete financial snapshot of the property. This means looking way beyond the monthly rent check to uncover every dollar coming in and—more importantly—every single dollar going out.
The biggest mistake I see new investors make is only accounting for the obvious: rent minus the mortgage. That simple math is the fastest way to find yourself with a negative cash flow property that quietly drains your bank account month after month. A truly accurate analysis is a detailed accounting exercise, and it's what separates a successful investment from a financial headache.
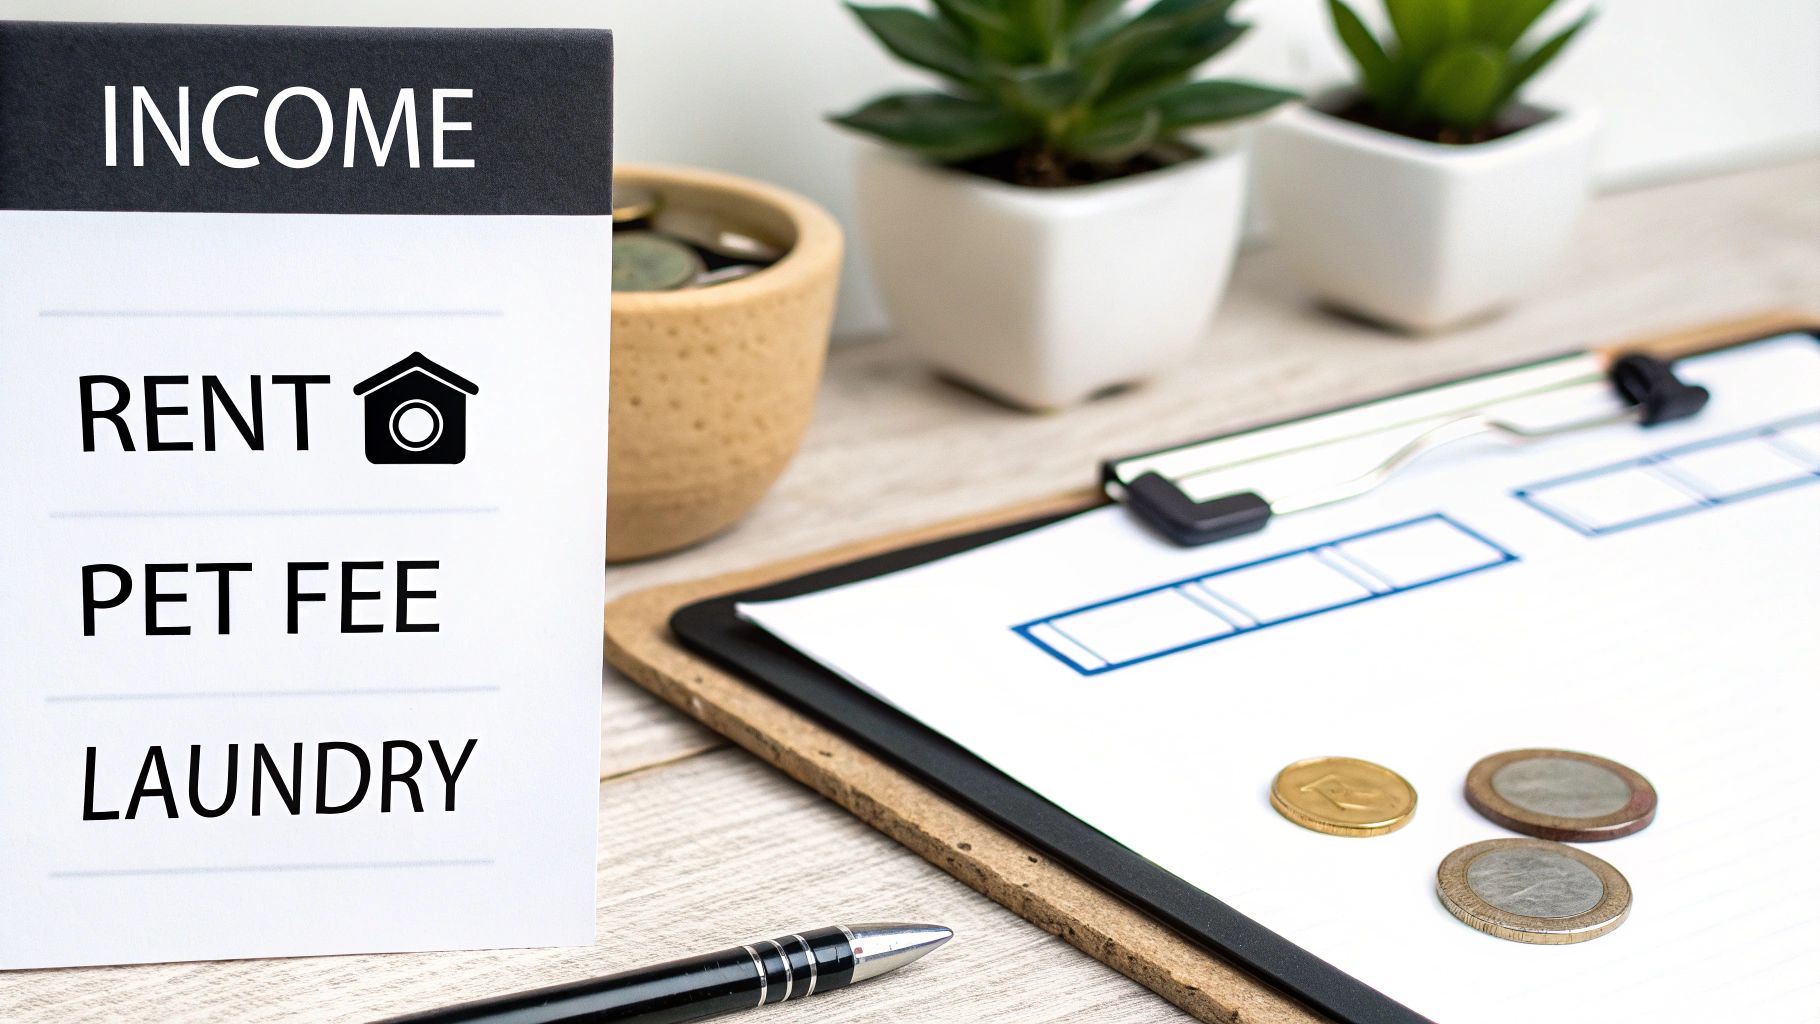
Uncovering All Income Streams
Your property's income potential starts with the gross rent, but it rarely ends there. To get the full picture, you need to identify every possible revenue source. When you add all these up, you get what's known as your Gross Potential Income (GPI).
Think about what tenants in your specific market actually value. Could you add any of these common income-boosters?
Pet Fees: This could be a one-time, non-refundable fee or, even better, a monthly "pet rent" that adds up significantly over the year.
Parking Fees: If parking is tight in the area, a dedicated spot is a valuable asset you can absolutely charge for.
Laundry Services: For multifamily properties, coin- or card-operated machines can generate a surprising amount of consistent, passive income.
Storage Units: Got an unused shed or basement area? Section it off into storage cages and rent them out for an extra monthly fee.
After you've tallied all that potential income, you have to bring it back to reality by subtracting an allowance for vacancy and credit losses. No matter how great your property is, you'll have downtime between tenants. A conservative estimate is usually 5-10% of your GPI, though this depends heavily on your local market's demand. The number you're left with is your Effective Gross Income (EGI)—a much more realistic starting point for your calculations. Getting this figure right is crucial, and you can learn more in our article about what effective gross income is in real estate.
Creating a Comprehensive Expense Checklist
This is where your diligence really pays off. Expenses can be sneaky, so you need to hunt them all down. I find it easiest to break them down into two main categories: fixed and variable.
Fixed Expenses are the predictable bills that stay pretty much the same every month.
Property Taxes
Homeowners Insurance
Mortgage Principal & Interest (P&I)
HOA or Condo Fees
Any flat-rate service contracts (e.g., landscaping, pest control)
Variable Expenses are the ones that fluctuate and require some smart estimation.
Repairs and Maintenance
Utilities (water, sewer, trash, gas, electric—if you pay for them)
Property Management Fees (typically 8-10% of collected rent)
Advertising and Tenant Placement Costs
Don't just pull these numbers out of thin air. Do the legwork. Call local insurance agents for real quotes, look up the property's tax records online, and get fee schedules from a few property managers. The more real data you use, the more you can trust your final analysis.
The Hidden Cash Flow Killer: Capital Expenditures
The one expense that trips up more investors than any other is Capital Expenditures, or CapEx. These aren't your typical small repairs like a leaky faucet. We're talking about the big-ticket, infrequent, but absolutely inevitable replacement of major components.
Think about a new roof, an HVAC system, a water heater, or all new kitchen appliances.
Failing to budget for CapEx is a catastrophic error. A property might look like it's cash-flowing beautifully on paper for a few years, but a single $15,000 roof replacement can instantly wipe out all of those gains if you haven't been putting money aside.
A good rule of thumb is to save 5-10% of your gross monthly rent specifically for future CapEx. Another solid method is to budget 1% of the property's purchase price annually. For a $300,000 property, that means saving $3,000 per year ($250 per month) in a separate account dedicated solely to these large-scale projects. By meticulously tracking every income source and every potential expense—especially CapEx—you're building the solid, realistic financial foundation needed to see a property's true potential.
Calculating Your Net Operating Income
Okay, you've done the legwork and gathered all your income and expense figures. Now it's time for the first—and arguably most important—calculation in any serious rental property analysis: Net Operating Income (NOI).
Think of NOI as the purest measure of a property's profitability. It shows you how much money the building itself can generate, completely separate from your personal financing situation. It’s the true bottom line of the asset.
The formula couldn't be simpler:
Gross Operating Income – Total Operating Expenses = Net Operating Income (NOI)
This number is your bedrock. It lets you compare two completely different properties on a level playing field, regardless of how an investor chooses to finance them.
Putting The Formula Into Practice
Let's go back to our duplex example. We've already figured out its potential income and lined up all the expected expenses. Now we just plug those numbers in.
Effective Gross Income (EGI): $34,200 per year
Total Operating Expenses: $13,500 per year (This covers everything from taxes and insurance to maintenance, CapEx, and management fees.)
Here’s the calculation:
$34,200 (EGI) - $13,500 (OpEx) = $20,700 (NOI)
That $20,700 is a critical piece of information. It tells us that, before we even think about a mortgage payment, this duplex is set to produce a solid annual profit. This is the core figure that tells you if the property is fundamentally a sound investment. If you want to dive deeper, you can check out our full guide on understanding Net Operating Income to boost your profits.
Why NOI Is The Investor's Benchmark
So, why do experienced investors obsess over NOI? Because it isolates the property's performance from the investor's financing choices.
Imagine you and another investor are eyeing the same duplex. You're planning to put 25% down, but they're coming in with a lower 10% down payment. Your mortgage payments are going to be wildly different, which means your final cash flow numbers will be, too.
But the property's NOI? It's exactly the same for both of you.
It’s an objective measure of the asset's raw earning power. This is precisely why commercial lenders and veteran investors lean so heavily on NOI when they're sizing up a potential deal. This principle is especially vital today, as market trends shaping rental demand show a continued shift toward renting, making properties with strong, predictable income streams more valuable than ever.
The Danger of Inflated Projections
Here’s a word of warning I can't stress enough: your NOI calculation is only as good as the numbers you feed into it. It’s incredibly tempting to get optimistic with your expense projections to make a deal look better on a spreadsheet. Maybe you trim the maintenance budget or pretend you'll never have a vacancy.
Don't do it. This is a classic rookie mistake that can sink you financially.
Always, always use conservative and realistic expense figures. Trust me, it’s far better to be pleasantly surprised when your costs come in lower than expected than to be financially blindsided by a property that's bleeding cash every month. A sober, realistic NOI is your best defense against a bad investment.
Uncovering Your True Cash Flow and Key Metrics
Once you have your Net Operating Income (NOI), you've established the property's core profitability—what it earns before the mortgage is even considered. But that's not the money that hits your bank account. To get to the real bottom line, we need to bring your financing into the picture. This is where the analysis gets personal and shows you what you'll actually pocket.
The final major expense to account for is your debt service. This is just the total of all your mortgage payments for the year, including both principal and interest. When you subtract this from your NOI, you get your pre-tax cash flow.
Let's stick with our duplex example to see how this plays out:
Net Operating Income (NOI): $20,700 per year
Annual Debt Service (Mortgage): $19,200 per year
The math is simple:$20,700 (NOI) - $19,200 (Debt Service) = $1,500 Annual Cash Flow
After paying every operational bill and the mortgage, this duplex is projected to put an extra $1,500 a year ($125 per month) into your pocket. That’s the number that really matters. If you're looking for a more detailed walkthrough, this guide on how to calculate cash flow on a rental property is a great resource.
Going Beyond Simple Cash Flow With Key Metrics
Seeing a positive cash flow number is a great start, but savvy investors don't stop there. To truly grasp how your investment is performing and, more importantly, to compare it against other potential deals, you need to dig into a few key metrics. These are the ratios and percentages that tell the real story of your investment's health.
This simple visual breaks down how we get to NOI—the foundation for all these important calculations.
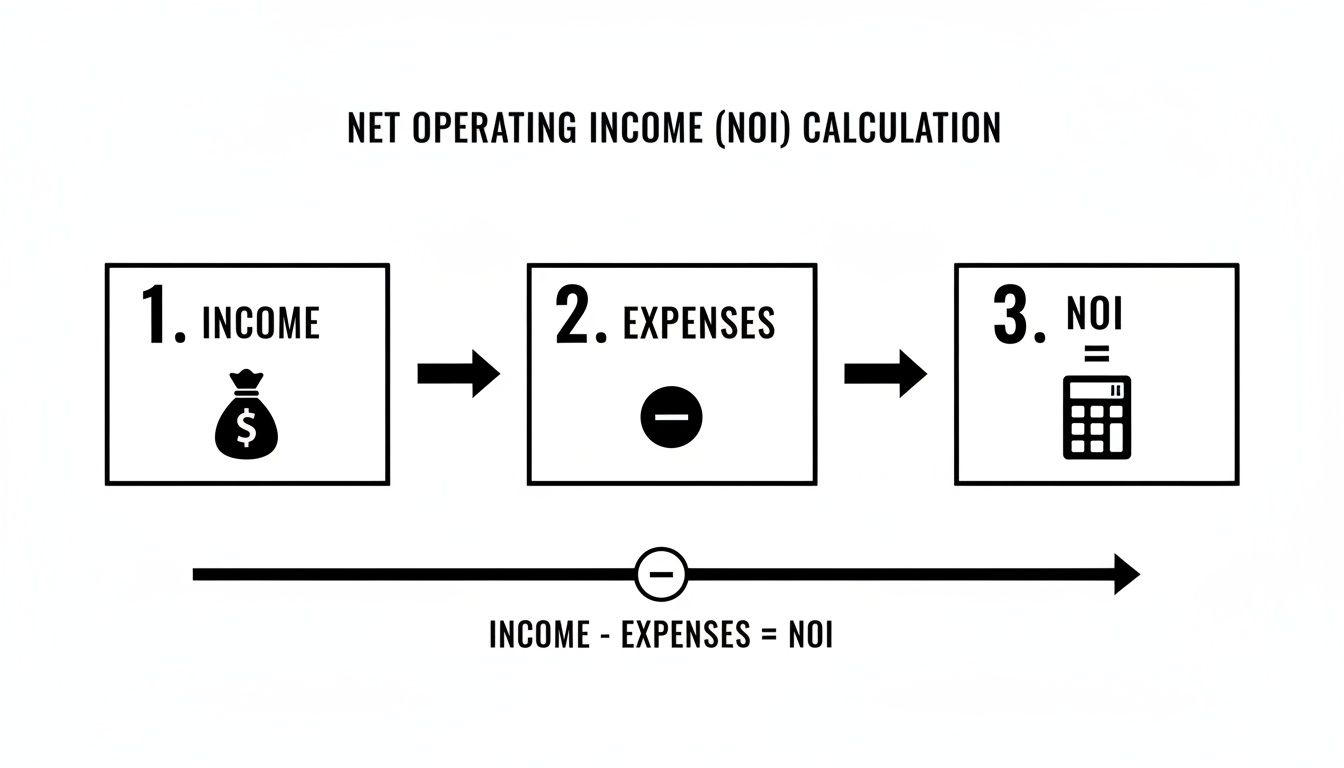
As the diagram shows, NOI is a pure measure of a property's performance before financing, which is why it's the universal starting point for comparing properties.
Measuring Your Return With Investment Metrics
For any rental property analysis, three metrics are absolutely essential: the Capitalization Rate (Cap Rate), Cash-on-Cash Return (CoC), and Return on Investment (ROI). Each one gives you a slightly different, but equally valuable, perspective on the deal.
Capitalization Rate (Cap Rate)
Think of the Cap Rate as the property's return if you were to buy it with all cash. It completely ignores financing, which makes it the perfect tool for comparing the raw earning potential of one property against another, regardless of how an investor plans to finance it.
Formula: Cap Rate = NOI / Purchase Price
Our Example: $20,700 (NOI) / $400,000 (Price) = 5.18% Cap Rate
Generally, a higher Cap Rate suggests a better return, but it can also signal higher risk. It’s all about context.
Cash-on-Cash (CoC) Return
This is the metric most investors live and die by. Why? Because it answers the most important question: "What return am I getting on the actual cash I pulled out of my pocket?" It measures your annual cash flow against your total initial investment (down payment, closing costs, renovation funds).
Formula: CoC Return = Annual Cash Flow / Total Cash Invested
Our Example: $1,500 (Cash Flow) / $105,000 (Total Cash) = 1.43% CoC Return
Your CoC return is highly sensitive to your financing structure. While a smaller down payment can boost this number, it also increases your risk. Many investors look for deals that can generate a CoC return between 8-12%, but this varies widely by market.
Return on Investment (ROI)
ROI gives you a more holistic view of your returns. It not only includes the cash flow you're receiving but also accounts for the equity you're building with each mortgage payment. It’s a powerful measure of long-term wealth creation.
Formula: ROI = (Annual Cash Flow + Annual Equity) / Total Cash Invested
Our Example: Assuming you build $4,000 in equity the first year. ($1,500 + $4,000) / $105,000 = 5.24% ROI
Investor Insight: Cash-on-Cash Return tells you what's happening with your cash right now. ROI gives you a clearer picture of your total wealth-building progress over time. You need to look at both.
Comparing Key Investment Metrics
This simple table can help you keep these crucial metrics straight and understand what each one is really telling you about your investment.
Metric | Formula | What It Really Tells You |
|---|---|---|
Cap Rate | NOI / Purchase Price | The property's unleveraged, raw profitability. Great for comparing deals quickly. |
Cash-on-Cash Return | Annual Cash Flow / Total Cash Invested | How hard your invested cash is working for you right now. The most popular leveraged return metric. |
Return on Investment | (Cash Flow + Equity) / Total Cash Invested | The total financial benefit you're gaining each year, including "hidden" returns. |
By moving beyond a simple cash flow calculation and analyzing these performance indicators, you arm yourself with the insights needed to make smart, confident decisions. You can spot a deal's strengths and weaknesses from a mile away and know exactly how it stacks up against any other opportunity.
How to Stress-Test Your Potential Investment
A cash flow analysis based on perfect conditions is just a fantasy. Let’s be real: tenants leave, water heaters break, and property taxes always seem to creep up. A truly great analysis doesn't just calculate what happens when everything goes right; it stress-tests the investment to see how it holds up when things inevitably go wrong.
This process is called sensitivity analysis, and it’s what separates investors who build lasting wealth from those who get blindsided by predictable market shifts. Think of it as a financial fire drill. By running the numbers on a few "what-if" scenarios, you get a much clearer picture of the real risks involved and can make decisions with your eyes wide open.
It’s all about turning anxiety about the unknown into a calculated risk you can confidently manage.
Creating Best-Case and Worst-Case Scenarios
The idea here isn't to predict the future with perfect accuracy. It's to understand your property's financial breaking points. The easiest way to do this is by modeling three distinct outcomes: most likely, worst-case, and best-case.
You already have your most-likely scenario—that's your original analysis based on realistic, conservative estimates. Now, let's build out the extremes.
Worst-Case Scenario: What if the local economy dips and your vacancy rate doubles from 5% to 10%? Or what if you're slapped with a surprise $5,000 HVAC repair bill in year one? Model these negative changes to see if the property still breaks even or if it starts hemorrhaging cash.
Best-Case Scenario: On the flip side, what if you're able to fill vacancies instantly, keeping your rate at a stellar 2%? Maybe you can add a small monthly pet fee that bumps up your "other income." This helps you understand the property's true upside potential.
Your goal isn't just to hope for the best. It's to ensure you can survive the worst. If a property's worst-case scenario means you have to dip into your personal savings every month, it might be too risky for your portfolio.
Key Variables to Adjust
When running your sensitivity analysis, you don't need to tweak every single line item. Focus on the variables that have the biggest impact on your bottom line. Changing just a few key numbers can reveal a lot about an investment's stability.
Here are the most important variables to play with:
Vacancy Rate: How high can this go before your cash flow turns negative?
Repair Costs: Add a large, one-time expense. Does a new roof wipe out an entire year's worth of profit?
Property Taxes: Assume a 10-15% increase after the sale. This is a common surprise for new owners in many areas.
Rental Rates: Model both a decrease in rent (if the market softens) and an increase (to see the potential upside).
This kind of forward-looking analysis is crucial, especially in a dynamic market. For instance, global private real estate values recently rose for five straight quarters, with transaction volumes hitting $739 billion over a 12-month period. For investors, this signals strong liquidity and pricing power for assets that can withstand market pressures. You can read more about these global real estate trends on Nuveen.com.
By stress-testing your assumptions, you’re making sure your property is one of those resilient assets, ready to perform well no matter what the broader market does next.
Smart Management Strategies to Boost Your Cash Flow
Once you’ve run the numbers, your cash flow analysis isn't just a static document—it’s a living roadmap. The figures on your spreadsheet are telling a story, pointing out where you can make changes to improve your bottom line. This is where smart, proactive management comes into play. It’s how you turn those numbers into actual cash.
This is about more than just collecting rent; it's about actively optimizing your asset’s performance. Even small, strategic adjustments can compound over time, turning a so-so property into a high-performer that consistently beats your initial projections.
Driving More Income from Your Property
The most straightforward way to improve cash flow is to increase your top-line revenue. Raising the rent is the obvious move, but there are plenty of other creative ways to generate extra income while adding real value for your tenants.
Here are a few strategies I've seen work time and again:
Utility Bill-Back Systems: Stop absorbing the cost of water, sewer, and trash. Instead, you can implement a Ratio Utility Billing System (RUBS), which divides these costs fairly among tenants. This simple change can add a significant amount back to your income column every single month.
Adding In-Demand Amenities: Think about what tenants in your market really want. Could you add an in-unit washer and dryer for an extra $50-$75 a month? Or maybe offer reserved parking spots for a fee? These upgrades often pay for themselves quickly and directly boost your gross income.
Allowing Pets (with Fees): A huge percentage of renters have pets. By making your property pet-friendly, you instantly expand your pool of qualified applicants. You can also charge a monthly pet rent, which goes straight to your bottom line.
Systematically Reducing Your Expenses
Just as critical as boosting income is plugging the leaks on the expense side. Every dollar you save on operating costs is a dollar added directly to your cash flow. This means shifting from a reactive mindset—fixing things when they break—to a proactive one.
A preventative maintenance schedule is one of the most powerful tools an investor has. Proactive service can reduce the cost of emergency repairs by as much as 32% compared to reactive maintenance, preventing small issues from becoming expensive catastrophes.
This proactive approach should apply to all your expenses. Get in the habit of shopping your insurance policies annually, appealing your property tax assessment when you have a case, and installing energy-efficient upgrades like LED lighting or low-flow toilets. These changes create lasting reductions in your costs.
Working with a professional property manager can also open up access to their network of vetted, affordable vendors, often providing cost savings you couldn't get on your own.
How Keshman Transforms Analysis into Action
This is where a partnership with a property management expert like Keshman can make all the difference. We don't just manage properties; we optimize them based on the data. We look at your property as the valuable asset it is and are constantly searching for ways to improve its financial performance.
From implementing utility bill-back programs to identifying the right value-add amenities for your market, our goal is to improve every line item in your rental property cash flow analysis. We use our proven preventative maintenance systems to cut down on surprise repairs, minimize costly vacancies with efficient tenant placement, and ultimately turn your analysis into a concrete, profitable action plan.
Got More Questions About Cash Flow? Let's Dig In.
Even with a solid grasp of the numbers, a few questions always pop up when investors start analyzing deals. It's completely normal. Let's walk through some of the most common ones I hear, so you can build your portfolio with real confidence.
What's a Good Monthly Cash Flow for a Rental Property?
Honestly, there's no single magic number. "Good" cash flow is all about your specific market, the type of property you own, and what you're trying to achieve as an investor.
For someone managing a 50-unit apartment building, a steady $100 per door might be fantastic. But if you're renting out a single-family home, you're probably looking for something more like $300 per month, or even higher.
A much better way to look at it is through your Cash-on-Cash Return. I always tell new investors to aim for an 8-12% return. It's a solid benchmark that lets you compare an apple-to-apples deal, whether it's a small condo or a duplex.
Should I Ever Buy a Property with Negative Cash Flow?
This is a big one, and the answer comes down to your personal strategy. It's not an automatic "no," but you have to know what you're getting into.
In hot markets where property values are climbing fast, some investors will stomach a small monthly loss. They're betting that rent growth and appreciation will more than make up for it down the road. This is a classic long-term appreciation play.
Just remember, this strategy means you're feeding the property out of your own pocket every month. It’s a calculated risk. If your goal is to generate income right now to pay your own bills, you should steer clear of negative cash flow properties entirely.
A Quick Word of Caution: A property with negative cash flow isn't necessarily a bad investment, but it is always a higher-risk one. Make sure you have the cash reserves to cover the shortfall for the foreseeable future.
How Often Should I Re-Analyze My Property's Cash Flow?
You absolutely have to run a deep rental property cash flow analysis before you sign on the dotted line. That's non-negotiable. But your job isn't done after you close.
I strongly recommend reviewing your numbers at least once a year. Think of it as an annual financial check-up for your property. An annual review shows you exactly how you're performing against your initial projections. You'll spot if maintenance costs are creeping up, see if the market will support a rent increase, and find other ways to fine-tune your investment for better returns.
What's the Real Difference Between Cash Flow and ROI?
It’s easy to get these two mixed up, but they tell you two very different—and equally important—stories about your investment's health.
Cash Flow: This is simple. It's the actual cash that hits your bank account each month after every single bill is paid, including your mortgage. It's the lifeblood of your investment, telling you if the property can pay for itself right now.
Return on Investment (ROI): This is the big-picture metric. ROI looks beyond just the monthly cash. It factors in the equity you're building as you pay down the mortgage and the appreciation in the property's value over time.
Think of it this way: cash flow tells you what you’re earning today, while ROI shows you the wealth you're building for tomorrow.
A killer analysis gets you in the door, but it’s the day-to-day management that makes a good investment great. At Keshman Property Management, we live and breathe this stuff. Our whole focus is on tweaking every little detail—from tenant screening to maintenance costs—to maximize your returns. We handle the grind so you can focus on finding that next deal.
See how our team of experts can boost your bottom line by visiting us at https://mypropertymanaged.com.


Comments