
Rental Property ROI Calculator | Maximize Your Investments
- Sarah Porter

- Sep 15, 2025
- 17 min read
A rental property ROI calculator is one of the most practical tools in an investor's arsenal. At its core, it’s a simple concept: it weighs your net profit against your total investment cost to tell you how hard your money is working. You plug in the numbers—purchase price, all your expenses, and the rental income—and it spits out the metrics that truly matter, like Cash on Cash Return and Cap Rate. It’s the fastest way to move from a gut feeling to a data-backed financial decision.
Why an ROI Calculator Is Non-Negotiable for Smart Investing

So many investors, especially when they're just starting, get caught up in superficial math. They see a property with a low sticker price and immediately think it's a home run, completely glossing over the dozens of hidden costs that can quietly drain their profits. This is exactly where a good rental property ROI calculator proves its worth.
Think of it as your mandatory financial reality check. It makes you confront the entire financial picture, not just the shiny rent check that comes in each month. Adopting this systematic approach gives you a massive strategic edge, changing the game for how you evaluate potential deals and manage the properties you already own.
Create a Level Playing Field for Property Comparison
Let's say you're weighing two very different options: a trendy downtown condo with steep HOA fees versus a suburban duplex that needs a little TLC. How do you objectively decide which is the better investment? This is where the calculator shines.
It standardizes your evaluation, letting you compare these completely different properties on a true apples-to-apples basis. By punching in the specific financials for each, you can clearly see which one projects a better return, regardless of its location, type, or condition. This data-driven approach pulls emotion out of the equation. You might personally prefer the vibe of the condo, but the numbers will always tell the unvarnished truth about its profit potential.
Uncover Hidden Costs and Avoid Nasty Surprises
One of the classic mistakes investors make is underestimating their expenses. A comprehensive ROI calculator forces you to think beyond the obvious PITI (principal, interest, taxes, and insurance) payment and account for everything.
Before you can run the numbers, you'll need to gather some key pieces of information. This step is crucial for getting an accurate picture of your potential return.
Key Inputs for Your ROI Calculation
Here’s a quick rundown of the essential data you’ll need to have on hand.
Data Category | Specific Inputs | Why It Matters |
|---|---|---|
Initial Investment | Down payment, closing costs, renovation/repair budget. | This is your total "cash in" and the foundation of your Cash on Cash Return calculation. |
Property Income | Monthly rent, other income (parking, laundry, etc.). | This is the gross revenue the property generates before any expenses are paid. |
Operating Expenses | Property taxes, insurance, HOA fees, maintenance, utilities. | These are the recurring costs that directly impact your net operating income and cash flow. |
Assumptions | Vacancy rate (e.g., 5%), property management fees (e.g., 10%). | These variables account for realistic operational factors that reduce your take-home profit. |
Getting these inputs right is the difference between a reliable projection and a useless fantasy. Don't guess—do your research for each specific property and market.
These often-overlooked costs can make or break a deal:
Property Taxes: A significant and unavoidable annual expense.
Landlord Insurance: Absolutely essential for protecting your asset from liability and damage.
Maintenance Reserves: Smart investors set aside funds for inevitable repairs—the 1% rule is a common starting point.
Vacancy Rate: No property stays rented 100% of the time. Factoring in a 5-8% vacancy rate is just smart planning.
Property Management Fees: If you’re not self-managing, this fee (typically 8-12% of rent) comes right off the top.
By forcing you to find and quantify these expenses, an ROI calculator grounds your projections in reality. It’s your best defense against the kind of future financial headaches that sink unprepared investors.
The scale of the global property management market shows just how complex this business is. Valued at $24.18 billion in 2024, it's forecasted to more than double to $52.21 billion by 2032, fueled by the continuous growth in real estate leasing. This explosion highlights just how critical precise financial management is to stay profitable. You can dig deeper into these rental property trends and see what they might mean for your own strategy.
Ultimately, using a rental property ROI calculator isn't just about crunching numbers. It's about developing a professional, strategic mindset. It empowers you to build a resilient and profitable portfolio based on sound financial principles, not just hopeful guesswork.
Getting the Right Numbers for an Accurate ROI Calculation
A rental property ROI calculator is a fantastic tool, but its results are only as good as the numbers you feed it. The old saying "garbage in, garbage out" has never been truer than in real estate investing. To get a clear financial picture of a potential deal, you have to roll up your sleeves and track down every single cost involved.
This process is about more than just data entry; it forces you to look past the exciting prospect of monthly rent and face the real-world costs of being a landlord. An overly optimistic guess on expenses can give you a dangerously high ROI projection, setting you up for a nasty surprise—or even a financial loss—down the line.
Let's walk through the essential numbers you'll need to pull together, starting with the initial cash you'll spend and then moving to the recurring costs.
Tallying Your Initial Investment Costs
This is all about figuring out the total cash you need to get the property and make it ready for its first tenant. It's so much more than just the down payment, and forgetting even one of these items can throw off your ROI calculation from the very start.
Here’s what you need to account for in your initial investment:
Purchase Price: The final price you're paying for the property. Simple enough.
Closing Costs: These are all the fees required to seal the deal. You can expect them to be around 2% to 5% of the home's purchase price. This bucket includes things like appraisal fees, loan origination charges, title insurance, and attorney costs.
Renovation and Repair Budget: Be brutally honest with yourself here. Does the place need a new roof before it's insurable? Will an updated kitchen help you get top dollar for rent? This "rehab" budget is a huge part of your initial cash outlay.
Initial Furnishing Costs: This is a big one for short-term or furnished rentals. The cost of every bed, sofa, and fork is a direct investment cost that needs to be tracked.
If you miss any of these, you're underestimating your total investment, which will make your projected returns look much better than they actually are.
Detailing Ongoing Operational Expenses
Once you own the property, the expenses don't stop. These are the recurring costs that chip away at your rental income every month. A trustworthy ROI calculation hinges on forecasting these costs with as much accuracy as you can.
Having a solid system for tracking your numbers is non-negotiable. If you're just getting started, our guide on [bookkeeping for rental properties made simple](https://www.mypropertymanaged.com/post/bookkeeping-for-rental-properties-made-simple) can walk you through setting up a process that works.
Here’s a breakdown of the most common operational costs you have to factor in:
Property TaxesThis is one of your biggest and most predictable expenses. You can usually find a property's tax history on the local county assessor's website. Just be aware that the county might reassess the property's value after you buy it, which could bump up your tax bill.
Landlord InsuranceThis isn't the same as a standard homeowner's policy. Landlord insurance is specifically designed to cover things like property damage, liability protection if a tenant gets hurt, and sometimes even lost rental income during repairs.
HOA or Condo FeesIf your property is in a homeowners' association or a condo building, you'll have monthly or annual fees. These cover shared amenities and maintenance, but they come directly out of your pocket and reduce your net income.
Maintenance and Repair ReservesTrust me, things will break. The water heater will eventually give out, the AC will die on the hottest day of the year, and appliances don't last forever. Smart investors build a reserve fund for these big-ticket items.
A great rule of thumb is the "1% Rule." Plan to set aside at least 1% of the property's value each year for maintenance. For a $300,000 property, that's $3,000 per year, or $250 a month, earmarked just for repairs.
Vacancy RateNo rental property stays filled 100% of the time. You'll have turnover between tenants, and it can take time to find the right person. A conservative vacancy rate to plug into your calculations is usually between 5% and 8% of your annual gross rent. In plain English, that means assuming you'll only collect rent for about 11 months a year.
Property Management FeesIf you hire a property manager, their fee is a direct hit to your bottom line. This typically runs between 8% and 12% of the monthly rent they collect. And even if you decide to manage it yourself, remember that your time isn't free—even though it won't show up as a line item on the calculator.
By taking the time to gather every one of these figures, you turn a simple calculator into a powerful forecasting tool. It gives you a much more realistic projection of your investment’s true potential and helps you make smarter decisions from day one.
Getting to Grips With the Core ROI Formulas
At the end of the day, a rental property ROI calculator isn't some black box spitting out magic numbers. It’s simply running a few essential formulas that tell you the financial story of your investment. Once you understand what’s happening behind the scenes, you can interpret the results with real confidence and pick the right metric for your goals.
We’ll start with the most basic calculation and then get into the metrics that seasoned investors use to compare deals and track performance over time. Each one gives you a slightly different, but equally valuable, perspective on your property’s profitability.
This visual gives you a great overview of how the numbers flow, from your initial investment all the way to the final ROI percentage.
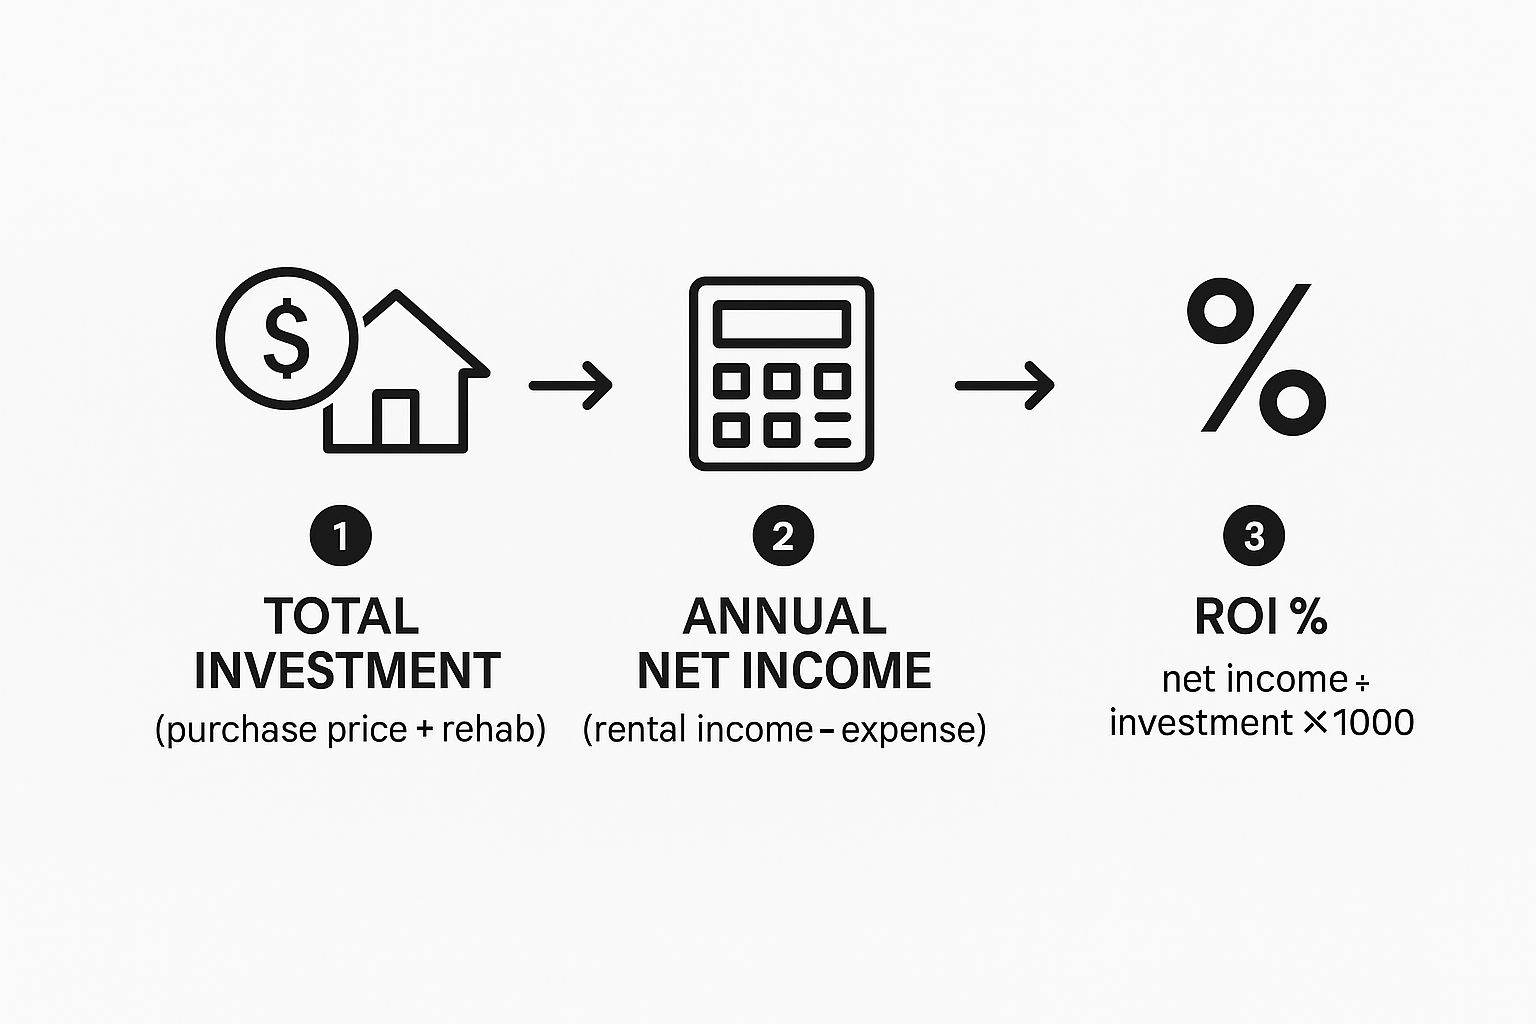
As you can see, it's a logical path: start with your total cash outlay, figure out your annual profit, and boom—you have your return as a simple percentage.
The Foundational ROI Calculation
The simplest way to size up your return is with the basic ROI formula. This gives you a high-level snapshot of your annual return compared to every dollar you put into the property. It's a fantastic starting point for understanding profitability, especially if you bought the property with cash.
The formula itself is pretty straightforward:
ROI = (Annual Net Profit / Total Investment) x 100
Let's walk through this with a real-world example. Say you buy a single-family home outright, no mortgage.
Purchase Price: $200,000
Closing & Rehab Costs: $25,000
Total Investment: $225,000
Annual Rental Income: $24,000 ($2,000/month)
Annual Operating Expenses: $6,000 (taxes, insurance, maintenance)
First, we need your Annual Net Profit: $24,000 (Income) - $6,000 (Expenses) = $18,000.
Now, we just plug that into the formula: ($18,000 / $225,000) x 100 = 8% ROI.
So, that 8% tells you that for every dollar you invested, you're getting 8 cents back each year. It’s a clean and simple number, but it doesn't paint the full picture, especially when you bring financing into the mix.
Cash on Cash Return: The Power of Leverage
Things get a lot more interesting when you use a mortgage to buy a property. You're using other people's money—leverage—to acquire a much larger asset than you could with just your own cash. This is where the Cash on Cash Return formula shines. It's specifically designed to measure how hard your actual cash is working for you in a leveraged deal.
Here’s the calculation:
Cash on Cash Return = (Annual Pre-Tax Cash Flow / Total Cash Invested) x 100
Let's take that same $200,000 house, but this time, we'll finance it.
Down Payment (20%): $40,000
Closing & Rehab Costs: $25,000
Total Cash Invested: $65,000
Annual Rental Income: $24,000
Annual Operating Expenses: $6,000
Annual Mortgage Payments: $9,600 ($800/month)
First, let's find your Annual Pre-Tax Cash Flow: $24,000 (Income) - $6,000 (Expenses) - $9,600 (Mortgage) = $8,400.
Now for the magic. Let's calculate the Cash on Cash Return: ($8,400 / $65,000) x 100 = 12.9% Cash on Cash Return.
See how much higher that is than the simple 8% ROI? That’s leverage in action. You put far less of your own money on the line but still control the same income-producing asset, which makes the return on your actual cash significantly more powerful. For any investor focused on maximizing cash flow, this is the number that really matters.
Capitalization Rate for Comparing Apples to Apples
So, what if you're looking at two different properties and want to quickly compare their raw earning potential, without getting bogged down by different financing scenarios? That's exactly what the Capitalization Rate, or Cap Rate, is for. It’s a favorite metric for commercial real estate pros because it’s so simple and effective.
The Cap Rate strips out financing details (like your mortgage) and just looks at the property's income relative to its current value.
The formula is clean:
Cap Rate = (Net Operating Income / Current Market Value) x 100
Your Net Operating Income (NOI) is just your annual income minus operating expenses, before you factor in any loan payments. Let’s go back to our first cash-purchase example:
Net Operating Income (NOI): $24,000 (Income) - $6,000 (Expenses) = $18,000
Current Market Value (Purchase Price): $200,000
Run the numbers: ($18,000 / $200,000) x 100 = 9% Cap Rate.
Generally, a higher cap rate suggests a higher potential return (and often, a bit more risk). It's the perfect tool for quickly sizing up multiple deals on the market. If you want to go deeper, our guide on what is cap rate in real estate investing breaks this essential metric down completely. Getting comfortable with these core formulas is the first step to truly mastering any rental property ROI calculator.
Putting the ROI Calculator to Work in the Real World
Knowing the formulas is one thing, but the real magic of a rental property ROI calculator happens when you start plugging in numbers from actual deals. This is where theory meets reality, and it's what separates investors who succeed from those who get blindsided by unexpected costs.
Let's walk through three completely different investment scenarios. By running the numbers on each, we can see exactly how the variables play out and make a smart, data-backed decision. After all, every property has its own financial DNA—unique income potential, different expenses, and its own risk profile.
Scenario 1: The Suburban Single-Family Home
First up is the quintessential "bread-and-butter" rental: a solid three-bedroom, two-bath house in a good suburban school district. These properties are magnets for long-term tenants, which usually means consistent income and steady appreciation. It's not a get-rich-quick scheme, but it's reliable.
Here’s how the numbers stack up:
Purchase Price: $300,000
Down Payment (20%): $60,000
Closing & Rehab Costs: $15,000
Total Cash Invested: $75,000
Monthly Rent: $2,500 (Annual Income: $30,000)
Annual Expenses (Taxes, Insurance, 5% Vacancy, 5% Maintenance): $10,500
Annual Mortgage Payment: $14,400
After running the math, the annual pre-tax cash flow comes out to $5,100. This gives us a Cash on Cash Return of 6.8% ($5,100 / $75,000). For many investors, this is a very attractive, stable return that lets them sleep well at night.
Scenario 2: The Urban Duplex
Next, let's consider a duplex in an up-and-coming urban neighborhood. The big appeal here is getting two income streams under one roof, which can create some nice economies of scale. While the cash flow potential is often higher, so is the management workload.
Let's break down the financials:
Purchase Price: $450,000
Down Payment (25% for multi-family): $112,500
Closing & Rehab Costs: $20,000
Total Cash Invested: $132,500
Monthly Rent (2 units @ $1,600/each): $3,200 (Annual Income: $38,400)
Annual Expenses: $14,000
Annual Mortgage Payment: $19,200
The annual pre-tax cash flow is a bit higher at $5,200. However, because of the much larger cash investment required upfront, the Cash on Cash Return is just 3.9%. This is a perfect example of how higher cash flow doesn't always mean a better return.
Scenario 3: The Vacation Rental Condo
Finally, we have a short-term rental in a buzzing tourist spot. This is a totally different game. You're chasing high nightly rates and big seasonal profits, but you also have to deal with income swings, much higher management fees, and more frequent wear and tear.
The numbers for this one are a wild ride:
Purchase Price: $250,000
Down Payment (20%): $50,000
Closing & Furnishing Costs: $25,000
Total Cash Invested: $75,000
Annual Gross Income (projected at 60% occupancy): $45,000
Annual Expenses (includes 25% management fee, utilities, HOA): $28,000
Annual Mortgage Payment: $12,000
The annual pre-tax cash flow is $5,000, which results in a Cash on Cash Return of 6.7%. That's nearly identical to the single-family home, but it gets there with way more gross income and much, much higher expenses. It’s a high-velocity model with more moving parts.
It's also worth noting how global trends can affect local investments. For instance, the UK real estate market saw an impressive 8.1% total return in the year ending February 2025. Meanwhile, annualized returns across Europe averaged 4.8% in 2024. Watching these larger market movements, as detailed in this global real estate market outlook, can give you a better sense of where the opportunities might be.
Key Takeaway: The calculator makes it plain to see. While the duplex brings in the most cash each year, the single-family home delivers a superior return on the money invested. The vacation rental has strong potential but carries significantly more risk and operational intensity.
Investment Scenario Comparison
To make the differences even clearer, here's a side-by-side look at how our three potential investments measure up against each other.
Metric | Scenario 1 (Single-Family) | Scenario 2 (Duplex) | Scenario 3 (Vacation Rental) |
|---|---|---|---|
Total Cash Invested | $75,000 | $132,500 | $75,000 |
Annual Gross Income | $30,000 | $38,400 | $45,000 |
Annual Expenses | $10,500 | $14,000 | $28,000 |
Annual Cash Flow | $5,100 | $5,200 | $5,000 |
Cash on Cash ROI | 6.8% | 3.9% | 6.7% |
This table neatly summarizes why you can't judge a deal by cash flow alone. The amount of capital you have to put in is a huge part of the equation.
Making the Final Decision
When you lay out the numbers this way, the decision becomes much clearer. The single-family home stands out with a strong 6.8% Cash on Cash Return and likely the least amount of management headache.
This kind of methodical analysis takes the emotion out of the equation and forces you to look at the cold, hard facts. It also drives home how crucial it is to get your expense projections right—a lesson that’s especially true for complex properties like short-term rentals, where a hefty management fee can make or break a deal.
To get an even better handle on your potential costs, check out our [property management cost calculator for rental owners](https://www.mypropertymanaged.com/post/property-management-cost-calculator-for-rental-owners). Using these tools together gives you the full financial picture before you even think about signing on the dotted line.
Using Your ROI Results to Make Smarter Decisions
Calculating your return on investment is just the starting line. The real magic happens when you use that number to sharpen your strategy. Once a rental property ROI calculator spits out the data, it’s up to you to turn those raw numbers into actions that actually build wealth.
Think of your ROI percentage like a financial health check. A low number isn't a sign of failure—it's a flashing light telling you that something in your operation needs a closer look. Is your income lagging, or are your expenses quietly eating away at your profits? This is the moment you graduate from being a landlord to a strategic investor.
Turning Data Into Dollars
The most straightforward lever to pull is always the rent. Your ROI calculation will tell you, in black and white, if your current rental rate is actually hitting your financial targets. If the numbers look weak, it’s time to run a fresh rental market analysis to see where you stand.
You might be surprised to find you’re leaving money on the table. Sometimes, a small rent bump—even just $50 to $100 per month—can make a huge difference in your cash-on-cash return for very little effort. It's often the fastest way to improve your bottom line.
Beyond a simple rent increase, your ROI analysis can also illuminate opportunities for value-add improvements. For instance, would a $5,000 investment in new kitchen appliances and an in-unit washer/dryer justify a $150 monthly rent increase? A quick run of the numbers shows that investment pays for itself in less than three years, after which it becomes pure profit and gives your long-term ROI a serious boost.
Strategically Slashing Your Expenses
The other side of the ROI coin, of course, is your expenses. A proper ROI calculation forces you to look at every single line item, which is perfect for spotting opportunities to cut costs.
Here are a few common areas where investors find savings:
Refinance Your Mortgage: If interest rates have come down since you bought the property, a refinance could lower your monthly mortgage payment and give your cash flow an immediate lift.
Appeal Your Property Taxes: Tax assessments aren't set in stone. If you have good reason to believe your property is overvalued, appealing the assessment could save you thousands over the years.
Shop for New Insurance: Don't just let your landlord insurance policy renew on autopilot. Get fresh quotes from a few different providers each year to make sure you're not overpaying.
Treat your annual ROI calculation as a financial accountability tool. It forces you to find and fix inefficiencies, helping you manage your properties with the precision of a business owner.
Setting Your Minimum ROI for New Deals
When you're looking for your next property, the ROI calculator becomes your most important filter. It helps you establish a firm, non-negotiable minimum ROI that a potential investment must clear. This data-driven approach keeps you from making emotional buys and ensures every property you add to your portfolio moves you closer to your goals.
Now, that's not to say you'd never buy a property with a lower initial ROI. If a property is in a neighborhood with massive appreciation potential, it might still be a brilliant long-term play. But that needs to be a conscious, strategic decision, not an oversight. Knowing your numbers empowers you to make that call with confidence.
It can also be helpful to see how your market stacks up globally. For example, investors chasing high yields might be interested to know that South Africa currently leads the world with a 10.15% gross rental yield. You can find more insights on global markets and discover the best places to buy property in 2025 on bma-business.com to get a broader perspective.
Common Questions About Rental Property ROI

Even with a solid rental property ROI calculator in hand, some questions always seem to surface. I've heard these from new and seasoned investors alike, so let's walk through the most common ones. Getting a handle on these nuances will help you read between the lines of your calculations and make smarter moves.
One of the first things everyone wants to know is what number they should be shooting for. It's a fair question, but the answer isn't as simple as a single percentage.
What Is a Good ROI for a Rental Property?
The honest-to-goodness answer is, "it depends." There's no magic number that works for everyone. What’s considered a “good” ROI is completely tied to your local market conditions, how much risk you're comfortable with, and what your big-picture investment goals are.
That being said, a lot of experienced investors I know generally aim for a Cash on Cash Return between 8% and 12%. This range is often seen as a sweet spot, suggesting you’ve got healthy cash flow after covering your mortgage and all other expenses.
But context is everything. An investor might happily accept a lower cash-on-cash return in a booming market where property values are skyrocketing. On the flip side, you’d want a much higher cash flow ROI in a riskier market where appreciation is less of a sure thing.
My take: Before you even look at properties, define what a "good" return looks like for you. An investor building a portfolio for immediate cash flow will have a very different target than someone playing the long game for appreciation and equity.
How Does Property Appreciation Affect ROI?
This is a fantastic question because it gets to the heart of how real estate builds wealth. The most common ROI metrics we've discussed, like Cash on Cash Return, are all about cash flow—the money your property generates day-to-day. They don’t factor in the appreciation or the loan principal you're paying down.
To see the full picture, you need to think in terms of your Total ROI.
It helps to separate the two concepts:
Cash Flow ROI (like Cash on Cash Return): This tells you how hard your invested cash is working for you right now, based on annual profit. Think of it as the money that hits your bank account each year.
Total ROI: This is the big one. It combines your annual cash flow plus the equity you've built over that same period, both from the property's value going up and the mortgage balance going down.
Appreciation is an incredibly powerful wealth-building tool, but it's also less predictable than rent. It’s the icing on the cake, but you can’t exactly spend it until you decide to sell or refinance.
How Often Should I Recalculate My Property ROI?
Calculating your ROI isn't a one-and-done deal you only do before you buy. Think of your property's financial performance as a living, breathing thing. The numbers will absolutely change over time.
I strongly recommend doing an annual ROI check-up for every single property in your portfolio. This yearly review is your chance to plug in the latest numbers and see how things are really performing.
Make sure to update your calculations with:
New Rental Rates: Did you raise the rent this year?
Updated Expenses: Property taxes, insurance, and HOA fees rarely stay the same.
Current Property Value: Get a broker price opinion or check recent comps to track your appreciation.
Taking this proactive approach helps you quickly spot an underperformer, find opportunities to boost income, and make clear-headed decisions about what to do next. It turns your calculator from a simple buying tool into a powerful ongoing management asset.
At Keshman Property Management, we believe in making data-driven decisions to protect and grow your investments. We use our 20 years of hands-on experience to optimize your property's performance, turning financial insights into tangible results. Learn how our transparent, owner-focused approach can maximize your earnings and simplify your life as an investor at https://mypropertymanaged.com.


Comments